Building a Budget


I'm getting to that point in my life where I have to start pretending to be an adult, and part of that is budgeting my spending. I spent a few hours this past weekend writing a custom budgeting spreadsheet in Google Sheets, which was my first dive into Google App Script.
I've always loved managing my finances, and I'm a data-oriented person, so tracking my expenses and categories is something I've toyed with before. For a while I tracked my expenses with You Need a Budget (which has a free student trial!), but a couple of annoyances stopped me from doing it for any long period of time. It took data straight from synced financial services, and showed things like transfers between synced institutions which was annoying to me. Showing transfer payments makes everything more confusing in my opinion, and it muddles your actual spending. Overall though, YNAB was nice, but I never kept up with it. I decided I wanted to build something custom, with the hope that the time investment of building it would keep me motivated in keeping it up to date.
When I sat down to build out a budget spreadsheet for myself, I knew I wanted it to be both minimal and flexible. I wanted to track my income, spending, and saving with amounts and categories for those values. I setup columns for four broad categories, "Income", "Need Spend", "Want Spend", and "Saving". For me, these are my four big types of money movement, and I'm content using them as broad categories. Each group has a column for a quick description, a column for a category, and a column for amount. I made these individual columns each named ranges in Sheets.
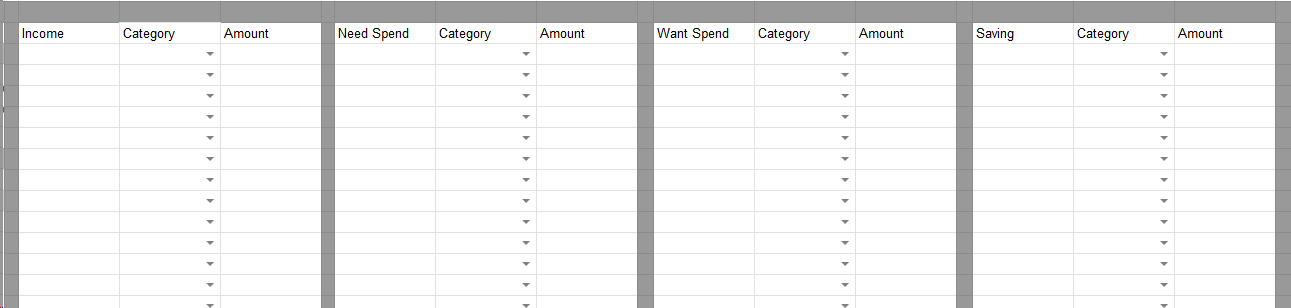
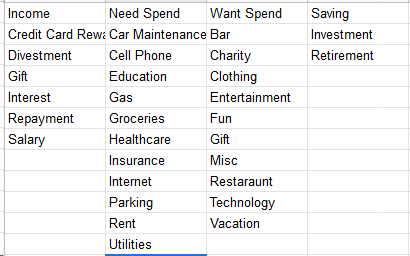
Inside each of my four categories, I have sub-categories, defined on another sheet called Categories and referenced through named ranges. By using custom drop downs defined through data-validation rules, I can ensure a consistent name is used for different categories, which makes the app script later a lot easier.
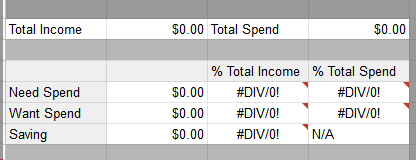
I built some simple =SUM(...) rules for summing up individual columns into cells representing their totals, and added some more formulas to calculate the percent each broad category was of the total spend or total income.
Google App Script
The interesting part of this adventure was writing Google App Script to support summing subcategories and then presenting their summations and the percentages they represented for my monthly budget. This was my first real dive into Google App Script, and it was a pleasant experience. I've written some rudimentary Microsoft Excel VBA before, and in many ways this experience emulated that one in a more familiar-feeling language. My script can be found at the bottom of this post in it's entirety, but I'm going to walk through most of it piece by piece.
My calculateCategories function does some initial setup and defines the locations future data will go into, then uses helper functions to do much of the actual work. First I needed to get the spreadsheet objects, which is straightforward enough.
  // get sheets
  var spreadsheet = SpreadsheetApp.getActiveSpreadsheet();
  var activeSheet = spreadsheet.getActiveSheet();
I'm a big best-practices guy, but I'm sure I missed a few while I was writing this. For example, there's probably a real way of making sure the script only runs on specific sheets. I don't know what it is, so I used a cell-check to ensure the macro was enabled, and this way my categories or other sheets won't be overwritten by the macro.
  // ensure the current sheet contains "budget macro enabled" in A2
  var val = activeSheet.getRange("A2").getValue();
  if (val != "budget macro enabled") {
    // don't execute!
    return;
  }
The last part of calculateCategories sets some variables up and then runs the helper functions. By using variables, I only have to change the code in one place if I reorganize the spreadsheet or rename things. Then I can iterate through the broad categories doing the real work with some helper functions.
  // constants
  var startRow = 12;
  var totalIn = "B4";
  var totalOut = "D4";
  var types = ["Income", "Need", "Want", "Saving"];
  var activeName = activeSheet.getName();

  // Iterate through types to build sums
  for (idx in types) {
    var map = buildMap(spreadsheet, activeName, types[idx]);
    startRow = writeData(activeSheet, startRow, map, types[idx], totalIn, totalOut);
  }
My function buildMap iterates over a single broad category per call. It pulls the subcategories from the Categories sheet and initializes their sum to 0. I use named ranges to minimize the impact of future column additions or deletions.
 var categories = spreadsheet.getRangeByName("Origin" + strName + "Categories").getValues();

  // initialize the map
  var map = {};
  // ensure map has a blank value
  map[""] = 0;
  for (row in categories) {
    for (col in categories[row]) {
      Logger.log(categories[row][col]);
      map[categories[row][col]] = 0;
    }
  }
The last part of buildMap then iterates through the entered categories and amounts on the active sheet and sums them into the map [object] structure I initialized. It again pulls from named ranges to know where categories and amounts are. Because the spreadsheet is duplicated, I identify named ranges with the active spreadsheet name prefixed to them.
// build sums
  categories = spreadsheet.getRangeByName(activeName + "!" + strName + "Categories").getValues();
  var amounts = spreadsheet.getRangeByName(activeName + "!" + strName + "Amounts").getValues();
  for (row in categories) {
    for (col in categories[row]) {
      map[categories[row][col]] = map[categories[row][col]] + amounts[row][col];
    }
  }
The writeData function does the actual insertion of the map values into the spreadsheet. Each call to this function only writes the data for a specific broad category. This is where I use a lot of the variables I setup earlier. The first part of the writeData function writes a header, which colors a separator for broad categories and denotes which category the below subcategories fall into.
// write a header row
  var values = [
    [ strName, "", "", ""]
  ]
  var r = activeSheet.getRange(startRow, 1, 1, 4);
  r.setBackground("lightgray");
  r.setValues(values);
  startRow++;
The last part of the writeData function iterates over the values in the map and does a handful of things. It writes the key in the map, which is the subcategory. It writes the total sum for that key, and then it set up a formula for the percent of total income and spend that sum represents. It's only appropriate to display the percentage of spend for the spend categories, so only those two categories have it. The code also sets formatting rules for the currency and percentage fields it writes.
// iterate through keys and write them
for (key in map) {
if (key != "") { // if the key is blank don't output it
// make sure the background is white
activeSheet.getRange(startRow, 1, 1, 4).setBackground("white");
// write the key
activeSheet.getRange(startRow, 1, 1, 1).setValue(key);
// actual sum
r = activeSheet.getRange(startRow, 2, 1, 1);
r.setValue(map[key]);
r.setNumberFormat("$0.00")
// write the formulas to calculate percents
a1Sum = activeSheet.getRange(startRow, 2, 1, 1).getA1Notation();
r = activeSheet.getRange(startRow, 3, 1, 1)
r.setValue("=(" + a1Sum + " / " + totalIn + ")");
r.setNumberFormat("0%");
// only do division by total spend if need or want
if (strName == "Need" || strName == "Want") {
r = activeSheet.getRange(startRow, 4, 1, 1);
r.setValue("=(" + a1Sum + " / " + totalOut + ")");
r.setNumberFormat("0%");
}
startRow++;
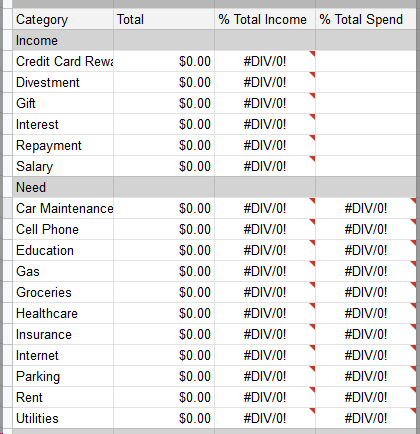
}Here's what the output looks like once it's been generated. This screenshot doesn't have any real values in it, so all percentages appear as #DIV/0!.
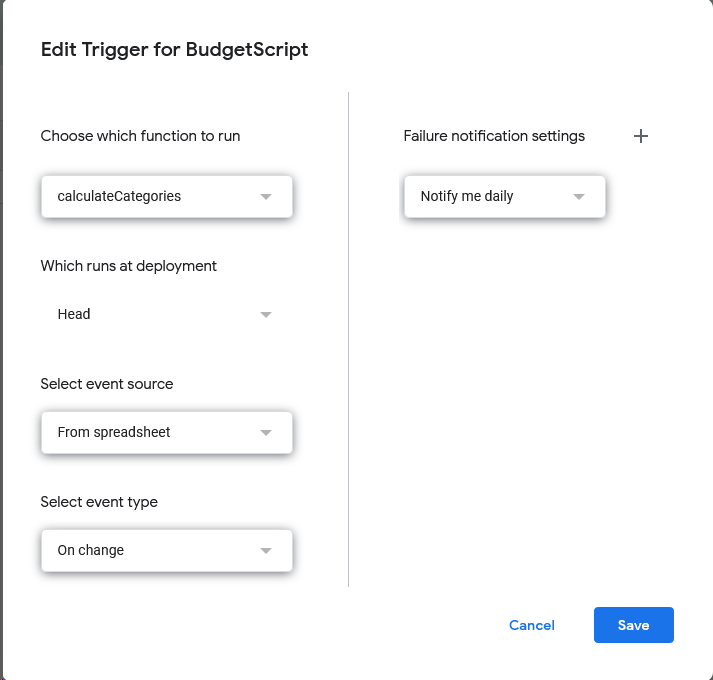
The last step is setting up a trigger so that the script runs on every edit. I edited triggers via the Google Scripts menu and added a new one so that every edit of the spreadsheet triggers the app script to run.
And that's it! I haven't uploaded the code to GitHub (do people do that with Google App Script?), so here it is in it's entirety, as I use it at time of writing this post. I don't currently intend to make a public version of the spreadsheet for sharing, but if you're interested in seeing it I can copy the template to a new spreadsheet and share it with you! Reach out to me on twitter or via email!
function calculateCategories() {
  Logger.log("Starting now.");
  // get sheet
  var spreadsheet = SpreadsheetApp.getActiveSpreadsheet();
  var activeSheet = spreadsheet.getActiveSheet();

  // ensure the current sheet contains "budget macro enabled" in A2
  var val = activeSheet.getRange("A2").getValue();
  if (val != "budget macro enabled") {
    // don't execute!
    return;
  }

  // constants
  var startRow = 12;
  var totalIn = "B4";
  var totalOut = "D4";
  var types = ["Income", "Need", "Want", "Saving"];
  var activeName = activeSheet.getName();

  // Iterate through types to build sums
  for (idx in types) {
    var map = buildMap(spreadsheet, activeName, types[idx]);
    startRow = writeData(activeSheet, startRow, map, types[idx], totalIn, totalOut);
  }
}

// builds the map of category to sum
function buildMap(spreadsheet, activeName, strName) {
  Logger.log(strName + " starting now.");
  var categories = spreadsheet.getRangeByName("Origin" + strName + "Categories").getValues();

  // initialize the map
  var map = {};
  // ensure map has a blank value
  map[""] = 0;
  for (row in categories) {
    for (col in categories[row]) {
      Logger.log(categories[row][col]);
      map[categories[row][col]] = 0;
    }
  }

  // build sums
  categories = spreadsheet.getRangeByName(activeName + "!" + strName + "Categories").getValues();
  var amounts = spreadsheet.getRangeByName(activeName + "!" + strName + "Amounts").getValues();
  for (row in categories) {
    for (col in categories[row]) {
      map[categories[row][col]] = map[categories[row][col]] + amounts[row][col];
    }
  }

  return map;
}

function writeData(activeSheet, startRow, map, strName, totalIn, totalOut) {
  // write a header row
  var values = [
    [ strName, "", "", ""]
  ]
  var r = activeSheet.getRange(startRow, 1, 1, 4);
  r.setBackground("lightgray");
  r.setValues(values);
  startRow++;

  // iterate through keys and write them
  for (key in map) {
    if (key != "") { // if the key is blank don't output it
      // make sure the background is white
      activeSheet.getRange(startRow, 1, 1, 4).setBackground("white");

      // write the key
      activeSheet.getRange(startRow, 1, 1, 1).setValue(key);

      // actual sum
      r = activeSheet.getRange(startRow, 2, 1, 1);
      r.setValue(map[key]);
      r.setNumberFormat("$0.00")

      // write the formulas to calculate percents
      a1Sum = activeSheet.getRange(startRow, 2, 1, 1).getA1Notation();
      r = activeSheet.getRange(startRow, 3, 1, 1)
      r.setValue("=(" + a1Sum + " / " + totalIn + ")");
      r.setNumberFormat("0%");

      // only do division by total spend if need or want
      if (strName == "Need" || strName == "Want") {
        r = activeSheet.getRange(startRow, 4, 1, 1);
        r.setValue("=(" + a1Sum + " / " + totalOut + ")");
        r.setNumberFormat("0%");
      }
      startRow++;
    }
  }
  return startRow;
}